Fast software wins, and milliseconds decide whether users stay or bounce. That’s why performance isn’t a nice-to-have—it’s survival. For teams using Playwright for automation, Playwright performance testing is adding another level to continued success.
Playwright gives teams the power to test real user interactions in real browsers. But the real advantage comes when those same automated tests reveal how efficiently an application runs.
The challenge? Measuring performance isn’t as simple as adding another test case. Without structure and strategy, it’s easy to collect numbers that don’t mean much, or worse, overlook the bottlenecks that frustrate users the most.
Done right, though, performance testing using Playwright turns every release into a confidence boost. It helps catch slowdowns early, make data-driven decisions, and keep software fast no matter how much it grows.
In this guide, we’ll break down how Playwright performance testing works, why it matters, how it fits into the broader automation ecosystem, and what steps you can take to make it a long-term advantage.
What is Playwright performance testing?
Playwright performance testing is the process of using Microsoft’s Playwright framework to evaluate how efficiently a web application performs under different real-world conditions. While Playwright is primarily recognized for end-to-end and functional testing, it can also capture detailed insights into front-end performance by measuring load times, responsiveness, rendering speed, and other key metrics that define the user experience.
Playwright’s value lies in its ability to automate browsers—including Chromium, Firefox, and WebKit—using a single API. This makes it possible to simulate real user interactions consistently across browsers and devices. When applied to performance testing, this capability goes beyond backend metrics and focuses on what users actually experience: how quickly the interface responds, how soon critical content becomes visible, and how stable the page remains during interaction.
Performance testing using Playwright allows engineering and QA teams to:
Identify bottlenecks that delay rendering or slow down interactivity.
Measure and compare performance across browsers and viewports.
Catch regressions during development through CI/CD integration.
Validate performance alongside functional and regression tests.
In essence, Playwright is an automated software testing tool that enables teams to extend their automated testing strategy into performance validation—without adding another specialized tool or disrupting existing workflows.
Why is performance testing with Playwright important?
Every millisecond matters. When web applications lag, users disengage, and business results suffer. Performance testing ensures that pages load quickly, respond smoothly, and maintain stability across browsers and environments. With Playwright, these checks can be built directly into automated testing pipelines, giving teams visibility into performance trends long before deployment.
Traditional load or performance testing tools often operate in isolation, focusing solely on backend systems or synthetic metrics. Load testing with Playwright closes that gap by providing real-browser data—measuring exactly what a user would experience in a production-like environment. The framework’s automation capabilities make it ideal for collecting and tracking front-end performance metrics such as:
Time to First Byte (TTFB)
First Contentful Paint (FCP)
Time to Interactive (TTI)
Cumulative Layout Shift (CLS)
Through integrating these metrics into standard test suites, teams can identify how new code or dependencies impact performance with each release. Over time, this creates a feedback loop that improves both speed and reliability.
Measuring performance with Playwright also supports modern development goals like:
Shift-left testing: addressing performance issues early in the cycle.
Continuous optimization: monitoring performance over multiple builds.
Cross-browser consistency: validating that every user, regardless of device or platform, experiences fast load times.
Ultimately, Playwright transforms performance testing from a manual, late-stage process into a scalable, automated practice that safeguards both product quality and user satisfaction.
How performance testing fits into the automated testing ecosystem
Automated testing is an ecosystem, not a checklist. Each layer plays a distinct role in validating how well software performs and how reliably it behaves. Playwright performance testing sits at the intersection of these layers, connecting user experience with system performance.
When integrated into the same workflow as other automated tests, performance testing provides a continuous feedback loop—one that catches slowdowns, regressions, and inefficiencies before users ever notice them.
Functional testing
Functional testing validates that features work as expected across browsers, devices, and user flows. With Playwright, these automated tests also capture timing data in real time. That means a single test can confirm that a feature both works correctly and performs quickly.
The result is tighter alignment between usability and performance. Specifically, functional testing:
Verifies critical workflows (login, checkout, navigation)
Detects UI slowdowns or delayed responses early
Integrates seamlessly into CI/CD pipelines for continuous monitoring
This blend of precision and automation makes Playwright a cornerstone for automated functional testing strategies.
Component and UI testing
Before features are tested end-to-end, components must prove their reliability in isolation. Component testing with Playwright focuses on performance at the micro level. That is, how individual UI elements render, update, and interact.
For example:
Do modals appear smoothly without layout shifts?
Do animations or transitions delay user interaction?
How do different browsers handle the same UI behaviors?
Because these tests run in real browsers, engineers can measure front-end responsiveness long before integration. This level of visibility strengthens both UI stability and overall application performance, aligning perfectly with modern Playwright automated testing practices.
API and integration testing
Front-end responsiveness depends heavily on back-end performance. API and integration testing verify that communication between systems is fast and consistent, even under load.
Playwright API testing allows teams to send requests, mock responses, and monitor network calls without leaving the browser context. The advantages include:
Validating API speed and response accuracy
Detecting performance bottlenecks between layers
Measuring the end-to-end impact of data flow on UI rendering
Simulating concurrent requests to observe how APIs handle traffic spikes or parallel user sessions
Tracking request dependencies to identify cascading slowdowns caused by chained or nested API calls
This creates a unified view of performance across both client and server. It’s an efficient approach that aligns with advanced automated testing techniques used by mature QA teams.
Performance and regression testing
Performance testing is where everything converges. It measures how all layers—frontend, backend, and integrations—work together under real conditions.
Playwright captures browser-level metrics like:
Load time and Time to Interactive (TTI)
Cumulative Layout Shift (CLS)
Script and network request timing
When these metrics are paired with automated regression testing, teams can detect not only when something breaks, but also when it slows down. Each release then becomes an opportunity to improve speed and stability.
Performance testing in this context isn’t about “how fast can it load?” but “how consistently can it stay fast?” across builds, devices, and environments.
Bringing it all together
Each layer of testing reinforces the others. Together, they form a self-sustaining cycle of quality that makes performance part of every sprint. To summarize:
Functional tests verify accuracy
Component tests refine stability
API tests secure communication
Performance tests validate efficiency
Regression tests preserve reliability
How to measure performance testing with Plawright
The Playwright testing framework provides several methods for capturing detailed performance insights at both the page and system level. These measurements help QA and development teams monitor performance continuously.
Below are the most effective ways to measure performance using Playwright, and what each can tell you about your application’s real-world behavior.
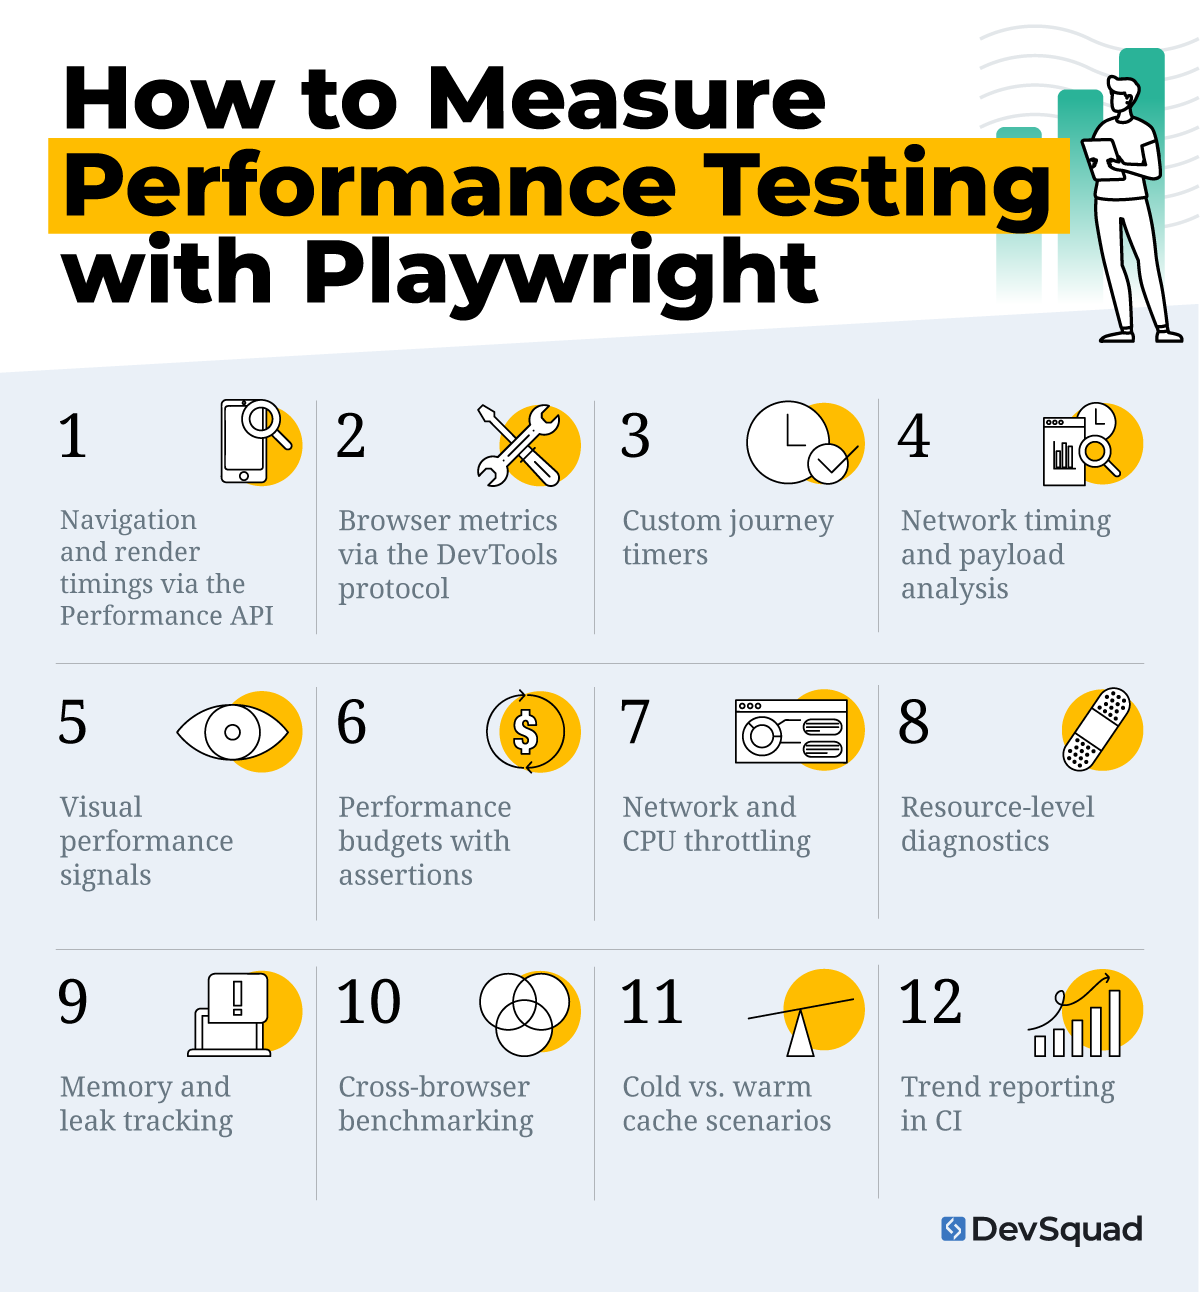
1. Navigation and render timings via the Performance API
The browser’s built-in Performance API allows direct access to page-level load metrics. Playwright can extract these values to quantify how efficiently a page transitions from request to interaction.
Purpose: Measure the overall page load lifecycle, from navigation start to user interactivity.
What to measure: Use page.evaluate(() => performance.timing) or PerformanceObserver to capture metrics such as Time to First Byte (TTFB), DOMContentLoaded, First Contentful Paint (FCP), and Largest Contentful Paint (LCP).
What the results reveal: How fast your application becomes usable after navigation, and which phases of loading cause visible delays.
2. Browser metrics via the DevTools protocol
Through Chromium’s DevTools protocol, Playwright can retrieve deep system metrics that affect performance beyond the DOM.
Purpose: Evaluate the browser’s internal resource usage and execution costs.
What to measure: Use Performance.getMetrics to gather CPU time, JS heap size, layout and paint counts, and DOM node totals.
What the results reveal: Which scripts, layouts, or memory allocations slow rendering and contribute to poor responsiveness.
3. Custom journey timers
Not all performance issues appear during full-page loads. Measuring specific workflows gives insight into real-world user experiences.
Purpose: Track the time it takes to complete user interactions or multi-step flows.
What to measure: Use performance.mark() and performance.measure() to calculate time between events—such as button click to content load or form submission to confirmation screen.
What the results reveal: How quickly critical workflows respond, and where interaction bottlenecks occur within the UI.
4. Network timing and payload analysis
Network efficiency is one of the biggest drivers of page speed. Playwright can observe all requests and responses during test execution.
Purpose: Understand how network traffic and resource size affect performance.
What to measure: Record request and response events, gather response.timing() data, or export HAR files for inspection.
What the results reveal: Which assets, API calls, or third-party scripts are responsible for slowdowns or excessive payloads.
5. Visual performance signals
Visual performance matters as much as raw timing. By capturing what users actually see, teams can connect metrics to real experience.
Purpose: Evaluate how quickly visible content appears and whether it shifts during load.
What to measure: Capture screenshots or video during render and analyze layout movement or flicker through visual diffs.
What the results reveal: When users first perceive content as ready and whether layout instability (CLS) disrupts that experience.
6. Performance budgets with assertions
Automated thresholds prevent performance regression from sneaking into builds.
Purpose: Define measurable performance standards for every deployment.
What to measure: Set thresholds for key metrics like FCP < 2s, LCP < 2.5s, CLS < 0.1, or total bundle size < 2 MB; fail builds that exceed them.
What the results reveal: Whether new code or dependencies degrade performance, providing immediate visibility before release.
7. Network and CPU throttling
Real-world users don’t all browse on high-speed networks or modern devices. Testing under constrained conditions provides a realistic benchmark.
Purpose: Simulate varied device and network environments.
What to measure: Use context or CDP throttling to limit bandwidth and CPU speed during tests.
What the results reveal: How well the application performs for mobile, rural, or low-power users, and whether optimization is needed for those profiles.
8. Resource-level diagnostics
Performance testing is often about pinpointing slow assets, not just slow pages.
Purpose: Identify which files most affect load and interactivity.
What to measure: Use performance.getEntriesByType('resource') to inspect timing for images, scripts, stylesheets, and fonts.
What the results reveal: Which resources should be optimized, compressed, or deferred to shorten render times.
9. Memory and leak tracking
Long sessions and complex SPAs can degrade performance if memory isn’t managed efficiently.
Purpose: Detect leaks or excessive resource use over time.
What to measure: Track JavaScript heap size or capture snapshots through the DevTools protocol.
What the results reveal: Whether the app’s memory footprint grows between interactions, signaling leaks or poor cleanup logic.
10. Cross-browser benchmarking
Performance consistency across browsers is critical to user experience.
Purpose: Compare performance between rendering engines.
What to measure: Run identical Playwright tests on Chromium, Firefox, and WebKit; capture the same set of metrics.
What the results reveal: Where browser-specific optimizations—or incompatibilities—impact performance.
11. Cold vs. warm cache scenarios
Caching can drastically change perceived load times. Playwright makes it easy to test both cases.
Purpose: Assess the difference between first-time and repeat visits.
What to measure: Clear storage and cache for “cold” tests; reuse context for “warm” cache runs.
What the results reveal: How effectively caching and service workers improve repeat-visit speed and reduce load dependencies.
12. Trend reporting in CI
Performance testing only adds value when tracked over time. Integrating results into CI provides ongoing visibility.
Purpose: Monitor and compare performance trends across builds and releases.
What to measure: Persist performance data in JSON or CSV files, then visualize trends in dashboards or reports.
What the results reveal: Continuous insight into regressions or improvements, empowering data-driven optimization decisions.
10 steps for successful Playwright performance testing
Playwright’s flexibility allows teams to build powerful performance suites, but success depends on process, not just tooling. A strategic, data-driven approach ensures that performance insights lead to measurable product improvements—not just test results.
Below are the core steps to running Playwright performance tests effectively and sustainably.
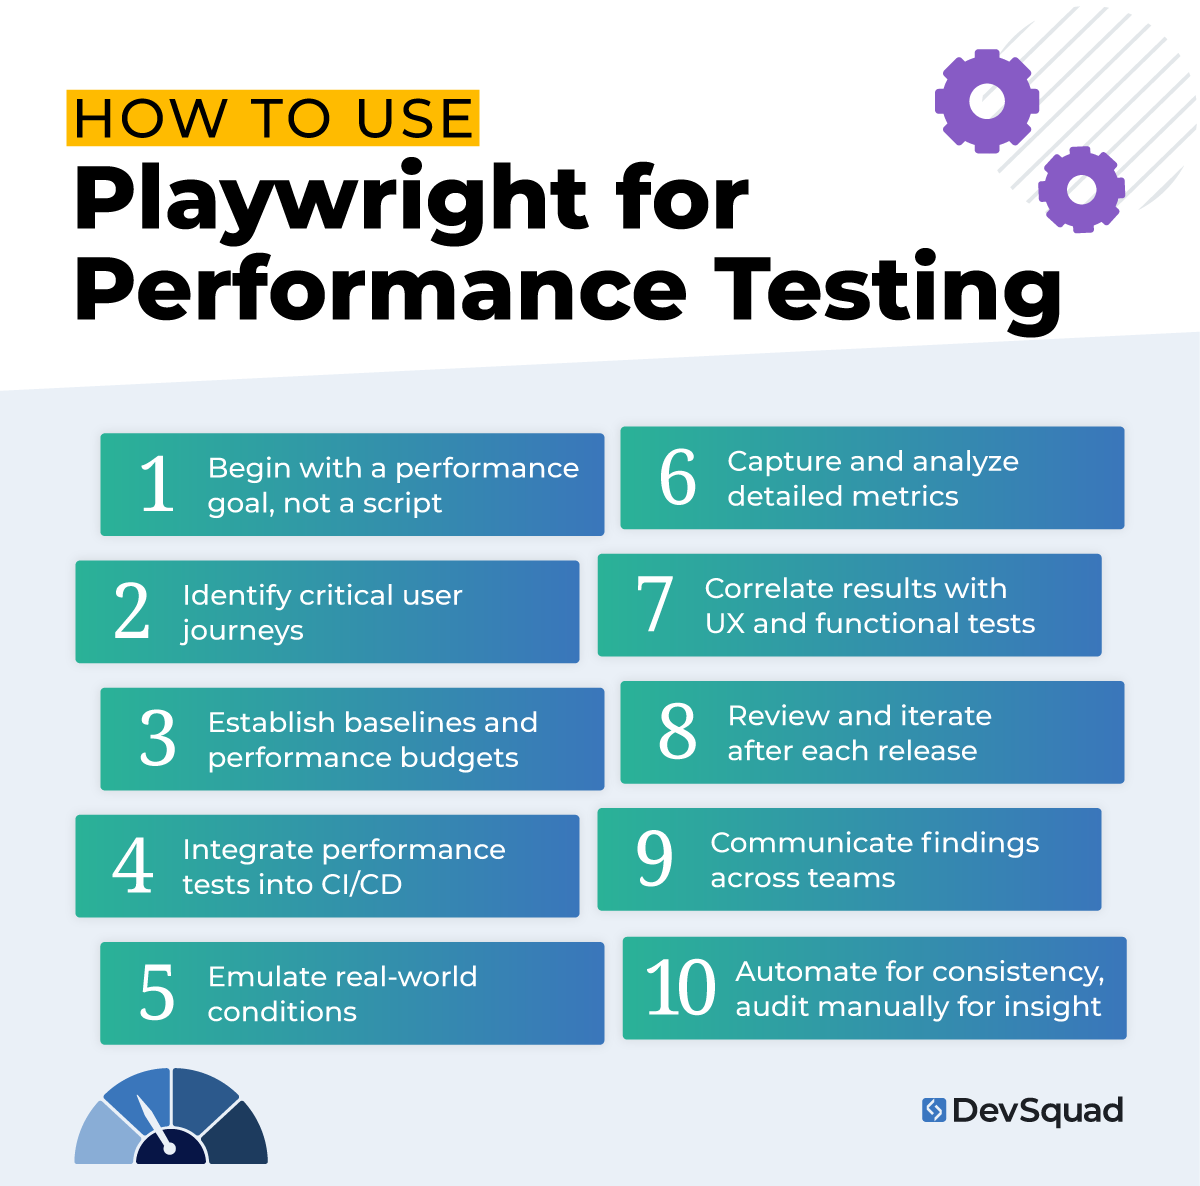
Step 1. Begin with a performance goal, not a script
Every performance test should start with a clear question: What are we trying to improve? Define your success metrics early—page load time, Time to Interactive, response speed, or resource utilization.
This step aligns performance testing with user experience and business objectives rather than arbitrary numbers.
Step 2. Identify critical user journeys
Rather than testing every page, focus on the interactions that define your product’s core value—like sign-ups, logins, or data retrieval flows.
Simulate these journeys in Playwright to reveal how performance impacts actual user behavior. By narrowing scope, teams collect data that matters and can take meaningful action on it.
Step 3. Establish baselines and performance budgets
Run your first tests to create a benchmark. Then, define performance budgets. Target thresholds for key metrics like FCP, LCP, or TTI.
These baselines provide context for every future run and transform performance testing into a continuous, measurable discipline.
Step 4. Integrate performance tests into CI/CD
Playwright integrates naturally into modern CI pipelines. Include performance tests alongside regression and functional checks, using thresholds to automatically fail builds when metrics degrade.
This practice aligns with agile delivery principles: small, continuous validations rather than massive post-launch diagnostics.
Step 5. Emulate real-world conditions
Use network throttling, device emulation, and environment variables to reflect the conditions your users actually experience.
Testing under multiple bandwidths, CPU speeds, and viewport sizes reveals hidden issues that ideal lab environments can’t replicate.
Step 6. Capture and analyze detailed metrics
Leverage the Playwright Performance API, CDP metrics, and network logs to collect raw data. Then, contextualize it: which scripts, endpoints, or assets are creating slowdowns?
Integrating this data into dashboards or CI reports helps track progress and guide targeted optimization efforts.
Step 7. Correlate results with UX and functional tests
Performance doesn’t exist in isolation. Combine performance metrics with outcomes from functional, component, and API tests to understand the holistic user experience.
This cross-analysis helps identify whether poor performance is due to front-end rendering, backend latency, or integration issues.
Step 8. Review and iterate after each release
After each deployment, compare results to your baselines. Log regressions, identify patterns, and refine test scripts to keep them aligned with evolving features.
This cycle of continuous improvement mirrors the agile feedback loop—small iterations that produce lasting performance gains.
Step 9. Communicate findings across teams
Share performance insights with developers, designers, and product owners. When everyone understands the metrics, optimization becomes a shared responsibility rather than a QA-only concern.
This transparency strengthens collaboration and keeps the team aligned around measurable, user-focused performance goals.
Step 10. Automate for consistency, audit manually for insight
Automation captures patterns at scale, but manual audits still have value. Schedule periodic human reviews—watch test replays, analyze visual shifts, and interpret anomalies automation can’t fully explain.
Combining both approaches creates balance: reliable automation plus human validation for edge cases.
Playwright performance testing best practices
Effective Playwright performance testing is about building habits that sustain speed and reliability release after release. Just like all automated regression testing best practices, best practices in performance testing turn one-off testing into a continuous quality process that supports better code, faster iterations, and stronger user experiences.
Treat performance testing as part of every sprint: Integrate Playwright performance tests into your sprint cycles, just like regression or functional tests, to detect slowdowns early and maintain consistency.
Prioritize real-world conditions: Simulate mobile networks, throttled bandwidth, and mid-range hardware so your performance data reflects real user experiences, not just ideal lab results.
Test before optimization, not after: Use Playwright metrics to identify actual performance bottlenecks before making code or infrastructure changes. Optimize based on data, not assumptions.
Use consistent environments: Run Playwright tests in controlled, repeatable conditions—such as dedicated QA environments—to eliminate variability caused by hardware or local system differences.
Measure both frontend and backend performance: Combine Playwright’s frontend insights with backend monitoring or API testing to uncover whether latency originates in the UI, APIs, or server logic.
Combine quantitative data with visual validation: Pair metric thresholds with screenshots or video captures to confirm layout stability, animation smoothness, and visual readiness.
Establish performance budgets early: Define clear thresholds for key metrics like FCP, LCP, and CLS. Use these budgets as guardrails in CI/CD pipelines to prevent regressions from slipping into production.
Automate test runs in CI/CD: Schedule Playwright performance tests to run automatically with each build or deployment, treating performance failures with the same urgency as functional bugs.
Track performance trends over time: Store results in JSON or dashboard reports and analyze trends across builds to identify gradual slowdowns or performance drift.
Focus on user-impact metrics: Prioritize metrics like Time to Interactive (TTI) and Cumulative Layout Shift (CLS), which best represent perceived user experience and usability.
Align performance ownership across teams: Make performance improvement a shared responsibility between QA, development, and design to foster collaboration and accountability.
Keep scripts maintainable and modular: Write Playwright tests using modular, reusable components to improve readability, maintain consistency, and simplify long-term updates.
Combine performance and regression testing: Include performance checks within your regression suite to validate that new features maintain both functionality and speed.
Review and recalibrate regularly: Revisit metrics, thresholds, and scripts periodically to reflect new technologies, browser behaviors, and evolving user expectations.
How to get the most out of your Playwright performance testing
Playwright performance testing is powerful, but also complex. Setting it up correctly takes deep technical understanding, structured automation workflows, and a long-term mindset. Without a clear process, performance testing can quickly become inconsistent or fail to produce actionable insights.
When implemented strategically, though, Playwright becomes more than a testing tool. It becomes a foundation for continuous performance improvement—helping teams catch regressions early, measure real-world speed, and deliver consistently high-quality experiences to users. The difference between a test suite that runs and one that drives measurable results comes down to setup, strategy, and expertise.
That’s where DevSquad comes in. Our automation testing services help teams build, optimize, and scale Playwright performance testing from the ground up. We design automated QA processes that integrate seamlessly into your development lifecycle, transforming performance testing into a proactive, repeatable part of product delivery.
At DevSquad, we don’t just automate your Playwright tests, we create a performance-driven testing culture that strengthens your software with every release.
Ready to start your Playwright performance testing? Learn more about our automation testing services.

Dayana Mayfield is a SaaS copywriter and content marketer specializing in SaaS marketing, positioning, and go-to-market strategy. She has consulted for over 195 SaaS companies, focusing on both traffic and conversions. She has been featured in Entrepreneur, Forbes, and Business Insider. Outside of work, Dayana writes SciFi novels and spends her evenings surviving auditions, rehearsals, and tech week as a proud theater mom.